Map Projects
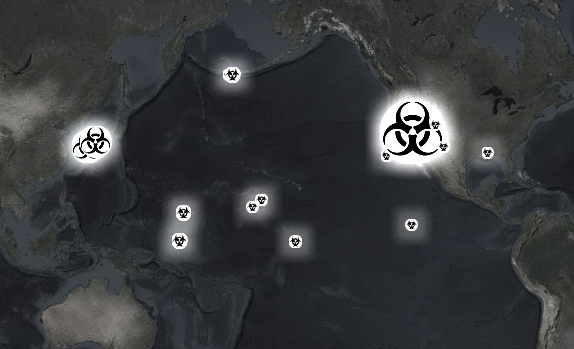
US Nuclear Detonation Map
This map represents all of the US nuclear device detonations since 1945, this project required substantial data collection and processing. I used Wikipedia s the source for all the information as it contained the most detailed accounting of the nuclear tests. It includes information such as Operation and device name, precise location and time of detonations, weapon yield, detailed notes, and more. Excel was used to download individual tables of data from the wiki pages, and then collated into a single sheet containing all the information. This data had to be thoroughly cleaned due to the "free form" nature of wikipedia. Most of it was accomplished using tools in Excel and some was cleaned by hand. This table was brought into ArcGIS Pro where it was georeferenced and the newly created laye was uploaded to AGOL. This layer was used to create the interactive map above.
View Interactive Map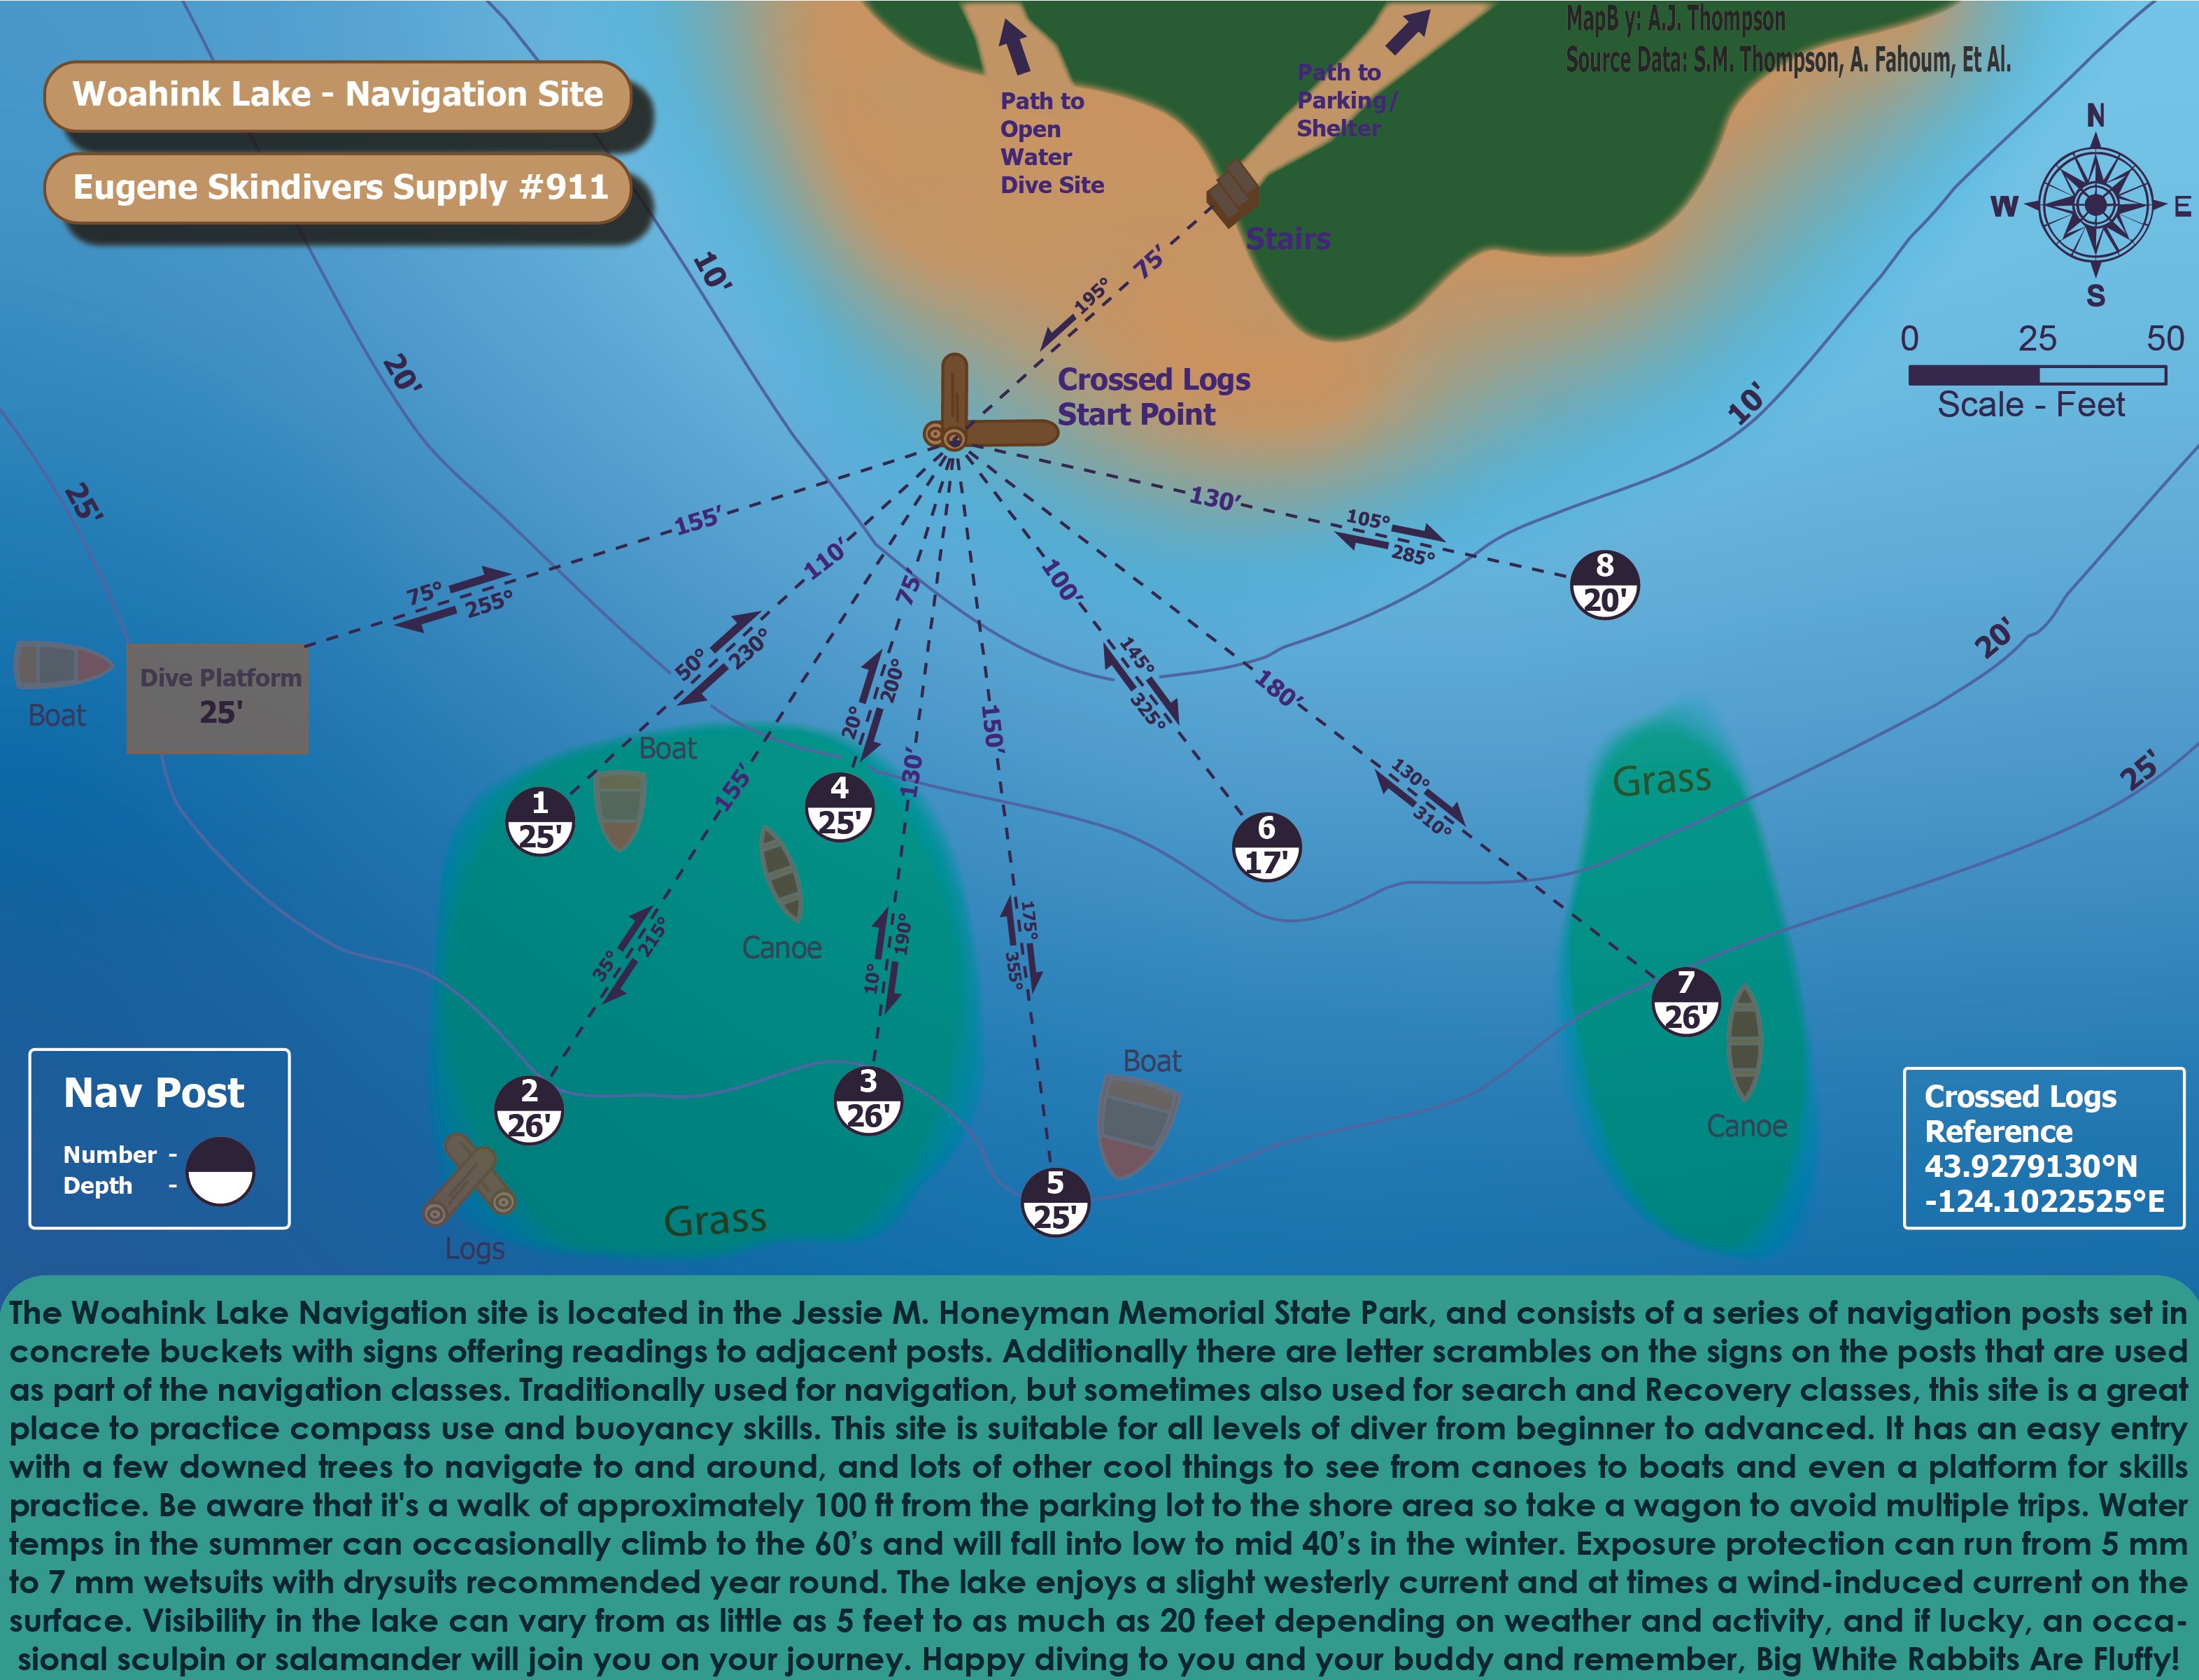
Scuba Navigation Map
This was a fun project to work on. I was given a to scale hand drawn map of the Woahink Lake Scuba Navigation Chart created by relatives of mine. It was my goal to digitize the map and create a style that could be easily understood by potential divers of the site, so that they may navigate the course themselves.
View full size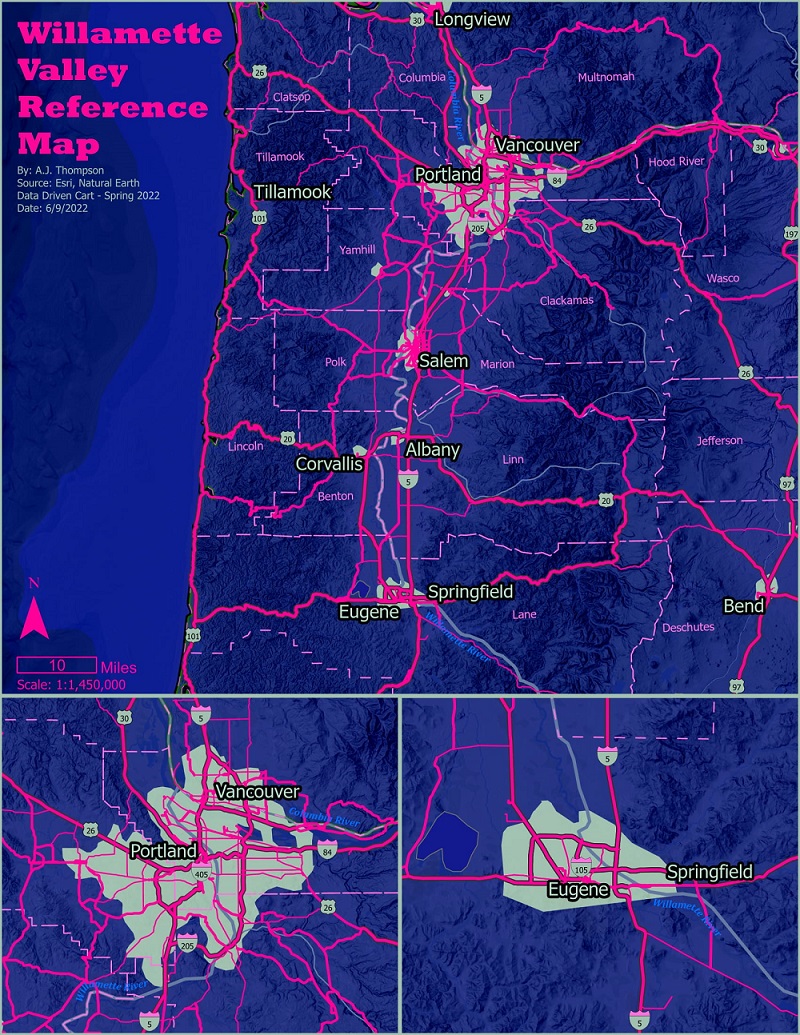
Cartography Reference Map
This project actually started out as a personal challenge. The GE for one of my cartography classes told us that no one should really ever use hot pink in their maps. becuase it "never looks good". I thought I would try and make it work, after trying a few color schemes and finding good reference online i settled on teh colors you see and created this map for that assignment.
View full size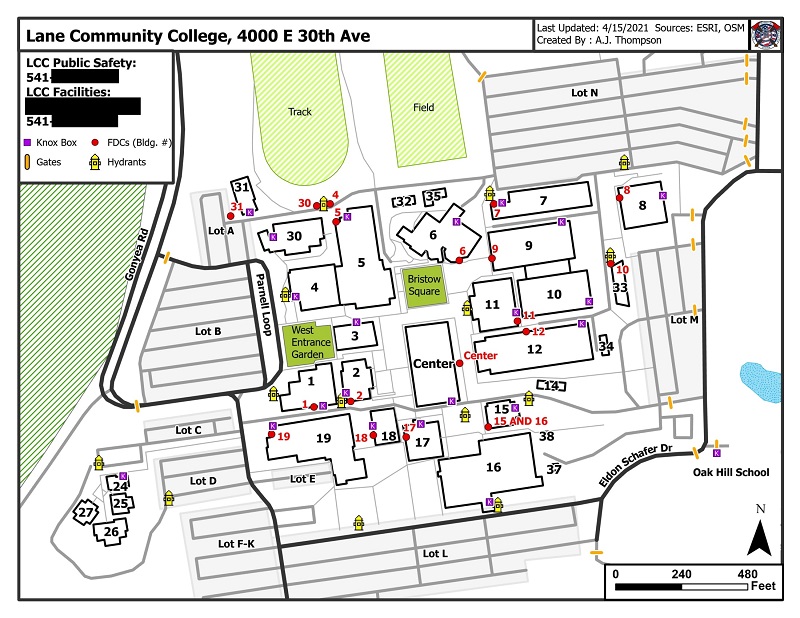
LCC First Responder Map
This map was designed as part of the Pre Plan Project. While it does not follow traditional cartographic principles, It is a highly functional map that provides the exact necessary details that first responders need when arriving at this location. It was designed to be extremely high contrast, as simple as possible while combining as much information as is needed, and had to be as to scale as possible. Once challenge was designing a symbology for the roads that didn't require a key, but also allows first responders to know what the accesibilty is in the area.
View full size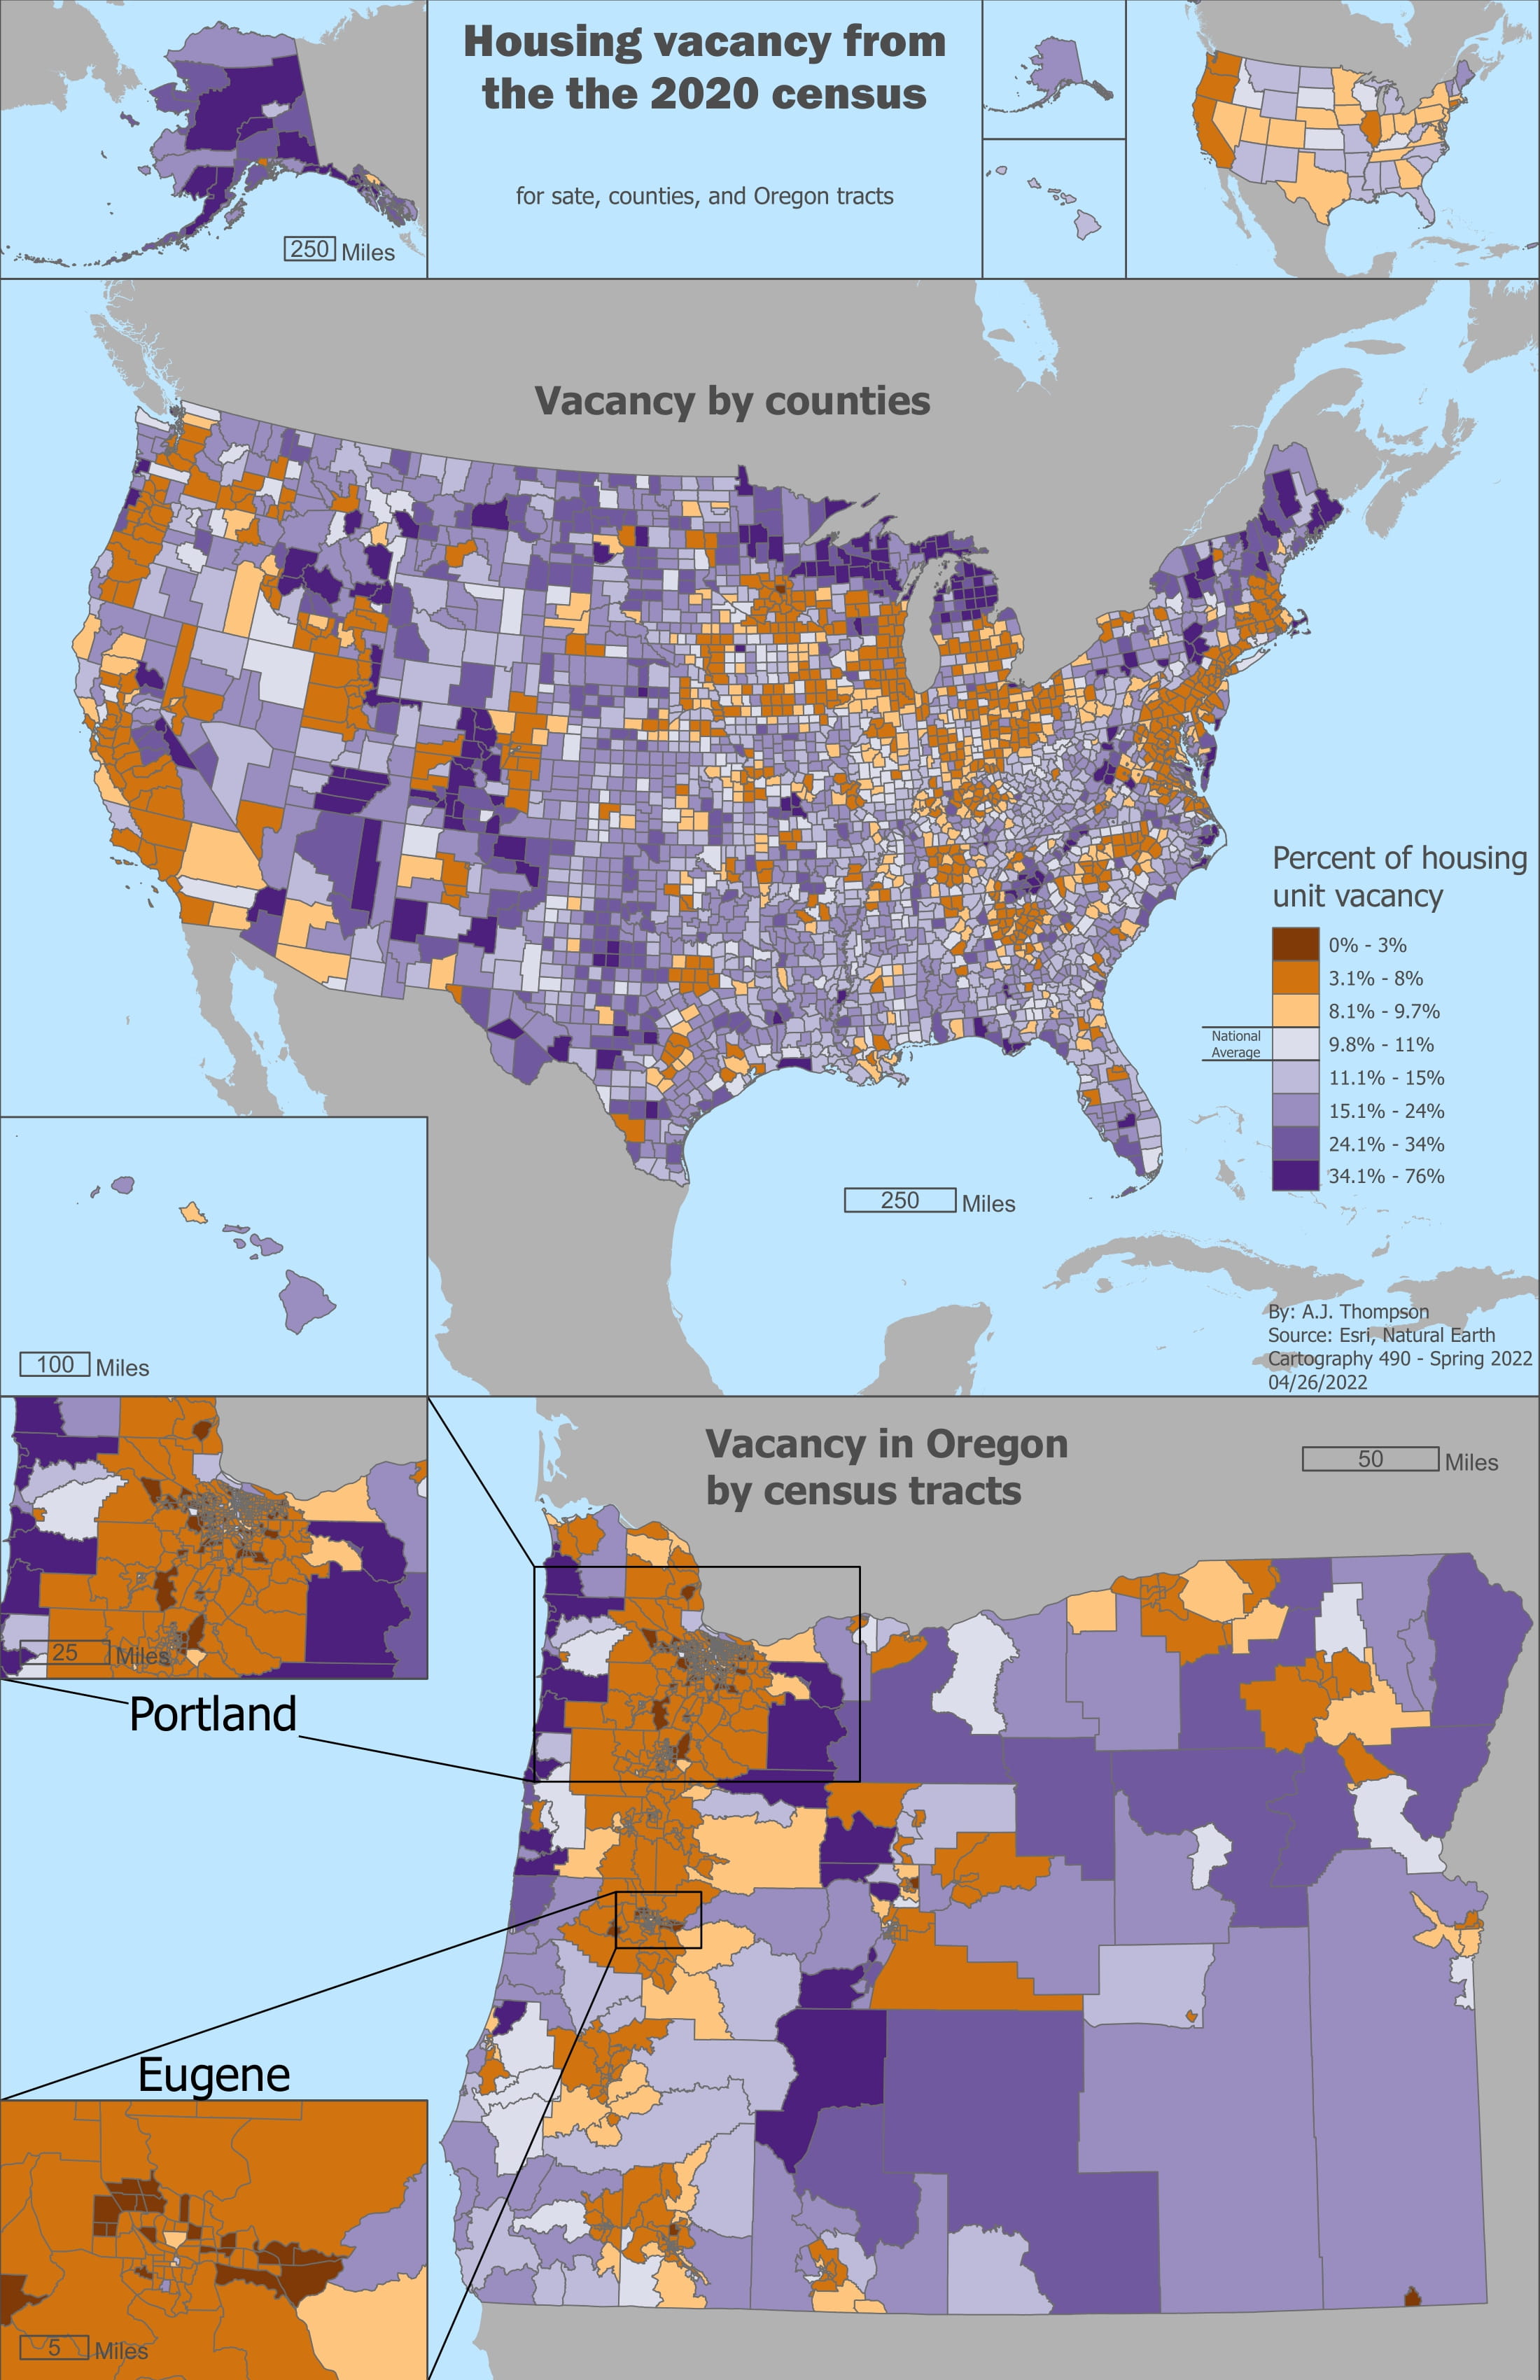
For this project I used census data to create a choropleth map of housing vacancy at various scales.
View full size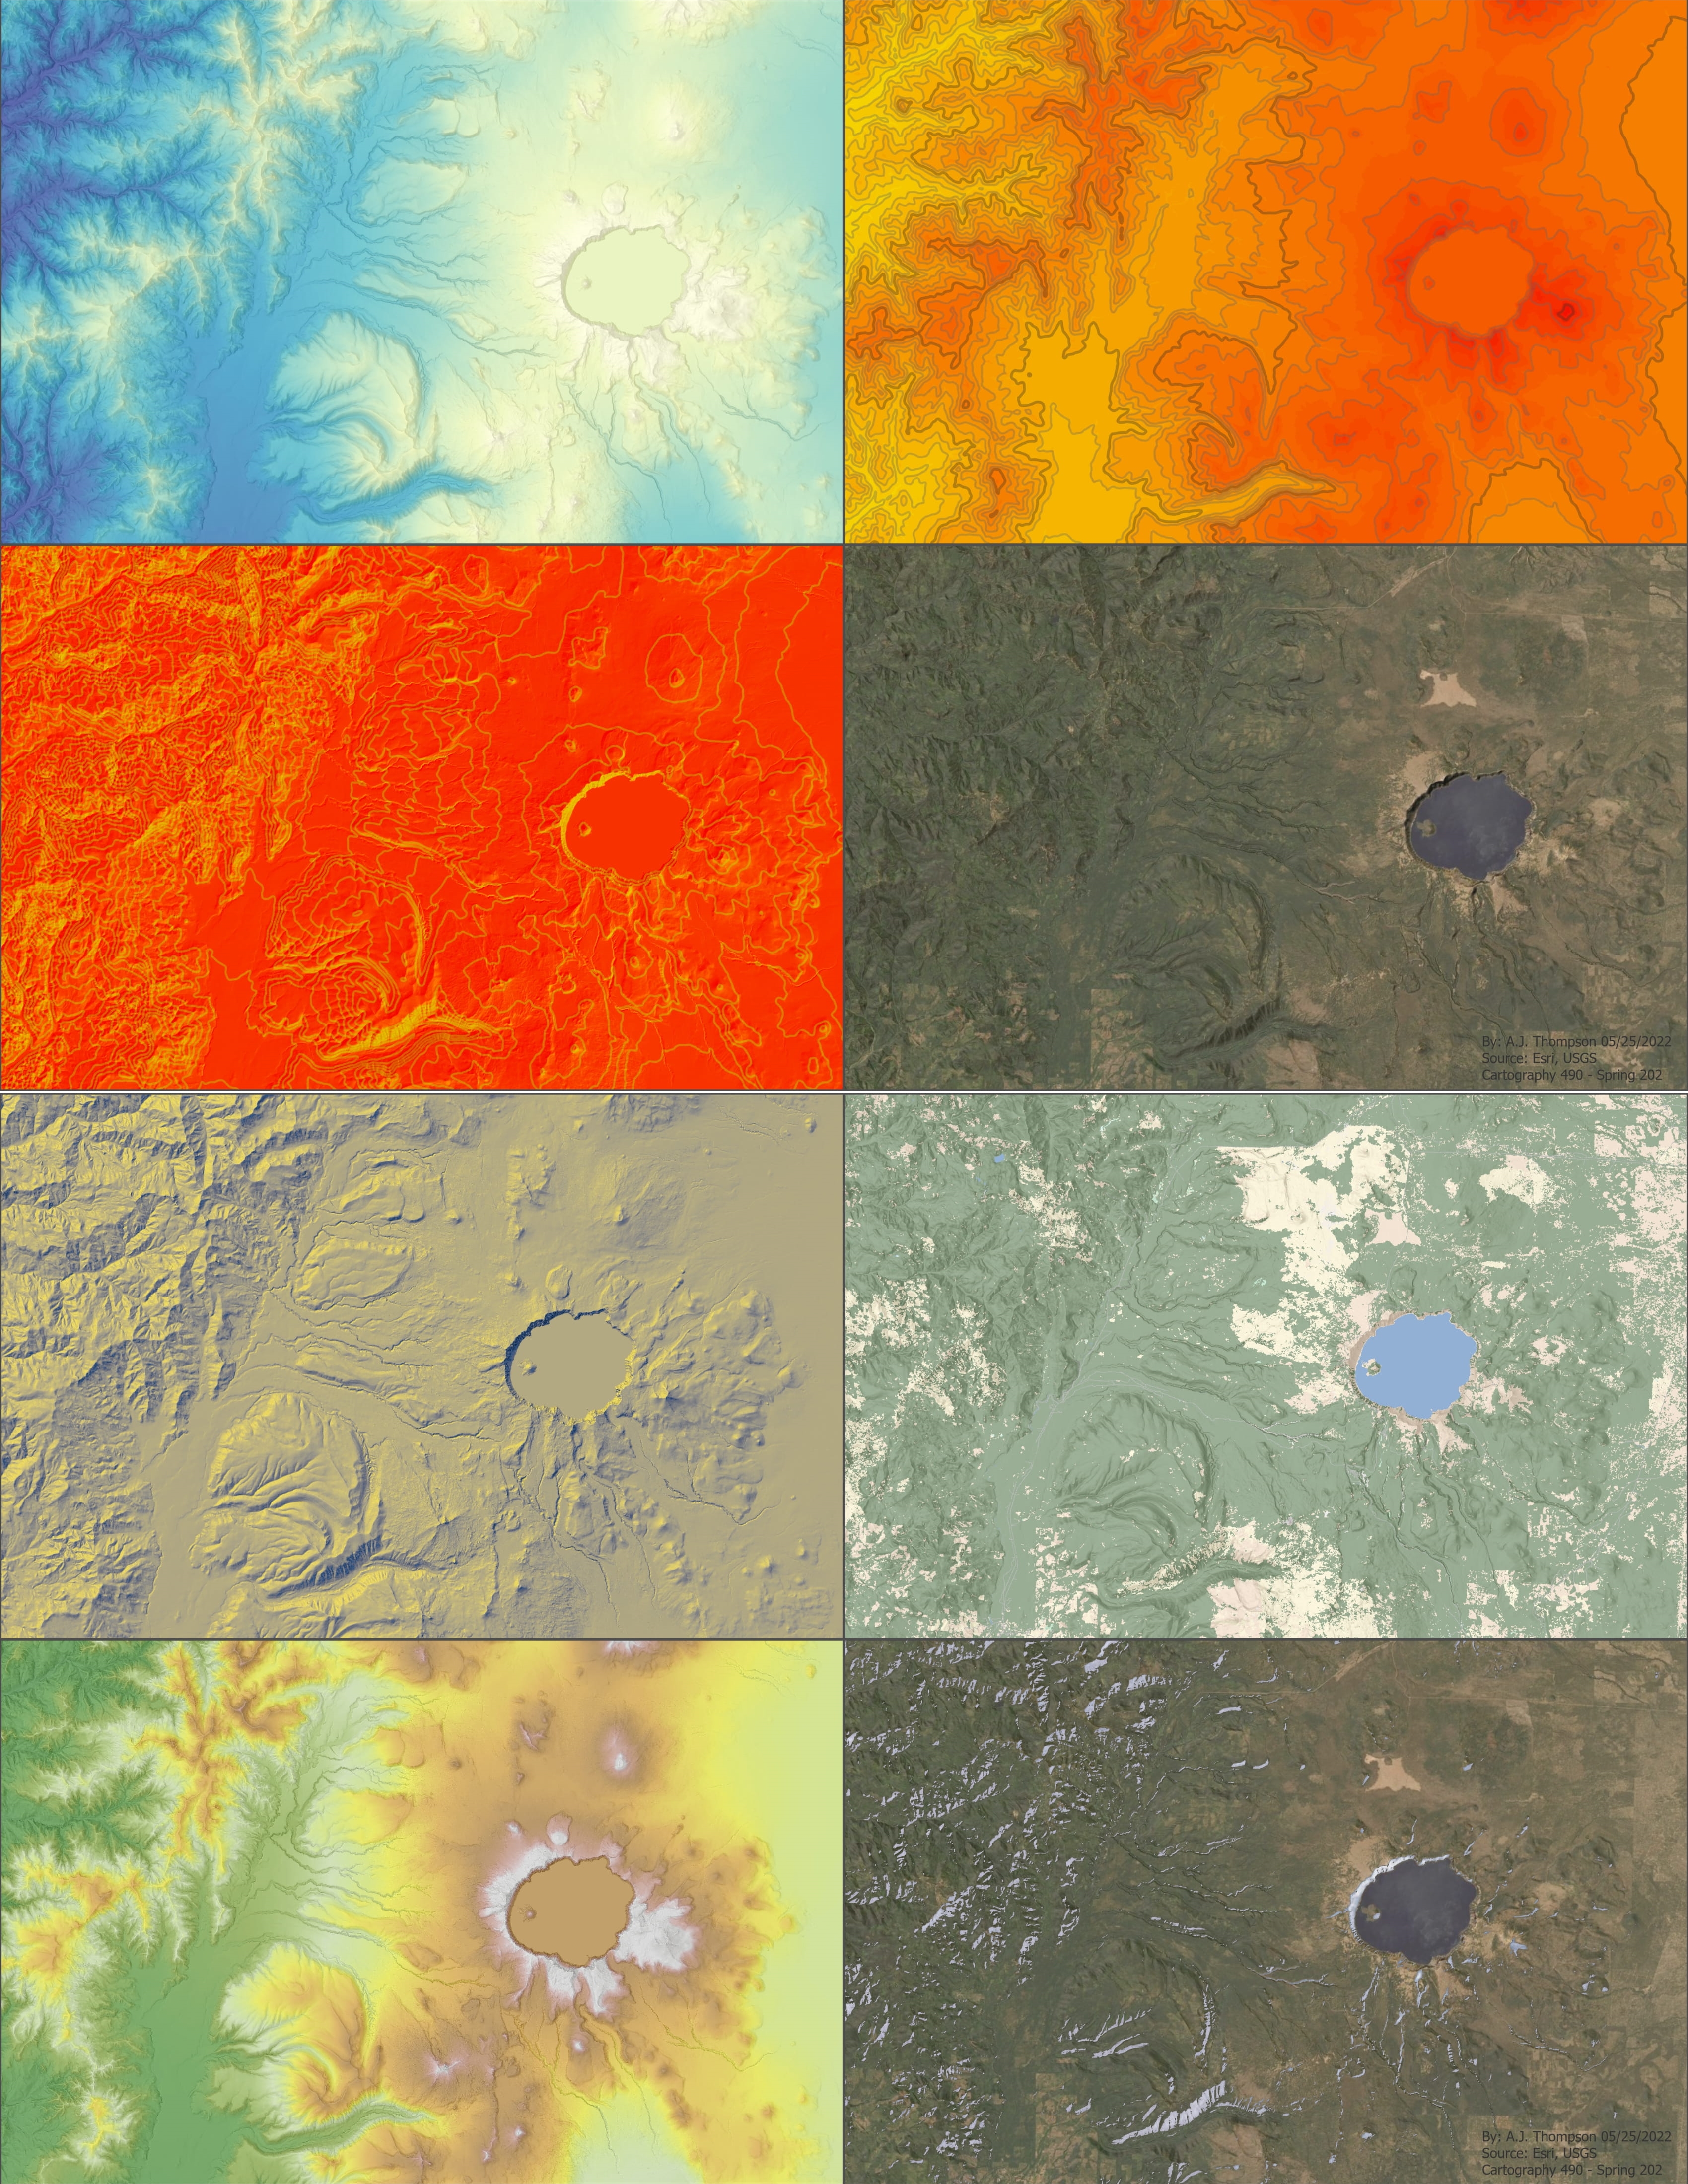
These images are all produced witht the same input data. Contour Lines, DEM, and Raster Imagery.
View full size